What a Joke! 3% Inflation? Are you kidding?
This morning during my self-required 30 minutes of reading about the financial world, I came across an interesting story. The authors of the story had an overt agenda of trying to portray the current administration’s first five years in the best possible light. Why publish such a story today? It is not being published today because the statistics or charts just became available but because tonight is the Constitutional mandated State of the Union address. Yes, the President is explicitly required by law to address Congress about how the country is doing.
One of the charts in this story showed what the rate of inflation has been since the President took office. Guess what the last recorded number was? No, try again – this time lower. The “official” inflation number was 1.5%. Are you kidding me?
I recently had to take a short business trip. Being parsimonious, as I happen to be, I booked a flight that required me to be at the airport at 4:30 in the morning. I made the long drive to the airport, parked my car in the long term parking lot and caught the first shuttle to the airport. As you can imagine, I was the only one on the bus. As I boarded the bus, I greeted the driver and sat in the first seat. I commented to the driver, “You’re up early.”
“Early?” he asked rhetorically. “I got up at 2:00 so I could be here and start driving by 3:00.”
I was amazed this seemingly well-dressed and well-spoken man was working such a job. He was what some might call middle-aged. As I continued to speak with him I learned he was once a VP at a well known company and made good money. He had done pretty well saving for his retirement which had commenced 13 years ago, but was now having to work a job to make ends meet.
“You see” he continued, “my financial planner told me that historically inflation had been 3% so I should plan on an average of 3% when calculating how much I would need in retirement.” “I found out too late that my financial planner was dead wrong.”
I really felt bad for the man. He had done everything right, he had worked hard and gone to school and obtained a good degree. He had worked hard during his career and appeared to have been a good employee, made his boss look good and helped the company to be profitable. He had diligently put money aside in his 401(k). So where had he fallen short? What resulted in his golden years not being so golden?
His number one mistake was not being better informed. He was not aware of how money works, what his money was doing, or what is really going on in the world of finance.
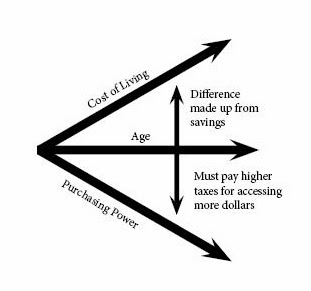
Getting back to my early morning bus ride: the driver went on to explain how he was being pinched two ways by inflation. Using the chart below, this is what he explained: “Every year since I retired, as the cost of living has gone up as a result of inflation, the buying power of my dollars has become less. The only way to maintain my standard of living is to make up the difference is by taking more and more from my savings. We realized we were being forced to make a decision – either lower the cost of living or get a job.” He went on to lament how accessing more of his dollars and/or having more income by having a job has affected his Social Security taxation.
I bid my new friend a kind farewell and ran into the airport terminal. Since then I have thought about his plight. You see, it goes almost without exception that when you sit down with a financial planner he will tell you to assume a 3 percent inflation rate. “That is the average over a long period of time” is what you are told.
How accurate is that statement? Read on and decide for yourself.
Very few people know that inflation is NOT what Uncle Sam is telling us. Even fewer know Bureau of Labor Statistics is the government entity that calculates the inflation rate. The BLS actually has two numbers, the core Consumer Price Index, more commonly called the CPI, and the non-core index. The CPI is what is used to determine Social Security benefits and the like. Well, guess what? The CPI, does not include food or energy. Yes, you read that correctly; the price of food is not included in the calculation. I guess eating is not all that important. And, apparently neither are utilities, gas and postage. Just a few minor exclusions.
Let us look at the cost of mailing a letter via the US Postal service. The USPS is a “not for profit” organization, so any cost increase in postage should be exactly that, increases in the cost of doing business. These costs would include salaries, equipment, and energy costs to run the trucks, heat their building etc. The price to mail a letter rose 3 cents (from $0.46 to $0.49) on January 26th 2014. The previous increase was 364 days earlier. How much did the cost of a postage stamp inflate during that year? Believe it or not, that is a annualized inflation rate of 6.52%. “Well,” you might argue, “that is such a short time frame. Looking over a longer term, it is surely much less than that.” Ok, giving away too much information; when I was born, the cost of a stamp was $0.04. Using that as a starting point, the inflation rate for postage stamps over that 47 year period is still 5.5%. Pray tell, where is the 3% your financial advisor has been telling you to use?
If something you thought to be true about money turned out not to be true, when would you want to know about it? How will you ever know what is true unless you take some personal responsibility and do some reading. A good place to start is here: www.financialtailwinds.com or www.financialfreedomrestored.blogspot.com. There are some seminal works from the Mises Institute here www.Mises.org as well which should be required reading in schools.
Leave a Reply
Want to join the discussion?Feel free to contribute!